Is Reno, NV, a Safe Place to Live? A Look at Crime Rates and Stats

Overview of Reno
Introduction to Living in Reno, NV
Ask ten Reno residents about what it’s really like living in the Biggest Little City, and you’ll get ten different answers.
Some rave about sunrise hikes along the Truckee River; others point to a nightlife that punches above its weight for a city of roughly 264,000 people — a Reno population that keeps creeping up each year.
Still, every newcomer eventually Googles the Reno crime rate and wonders whether the city is a safe place to live or just another casino town with higher crime rates than its mountain-town vibe suggests.
Geographical Location
Reno sits on the high-desert floor at the foot of the Sierra Nevada, twenty-three miles from Lake Tahoe.
The setting means big-sky sunsets, quick access to ski slopes, and four distinct seasons, so if you’re curious about what the weather is like in Reno, think low-90s in July, powder mornings in January, and 300 days of sun to enjoy it all.
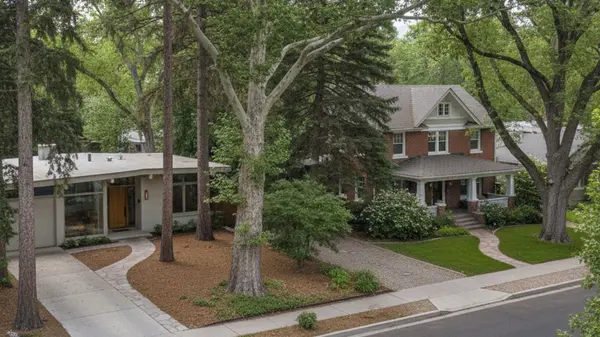
Cost of Living in Reno
The cost of living in Reno has inched a few ticks above the national average: recent calculators peg the overall index around 4% higher, with housing roughly 11 % pricier than the U.S. composite.
The cost of living in Reno feels manageable to many Californians fleeing Bay Area prices, but long-time locals still debate whether rising rents and the sizzling Reno housing market are nudging some crime trends upward.
Reno Crime Reports and Data
Property Crime
Property crime dominates local police logs. FBI-fed crime data compiled by AreaVibes shows roughly 7,000 reported property crimes in 2023 — a property crime rate of about 2,556 incidents per 100,000 residents, higher than the national average by 31 %.
Burglary, theft, and particularly vehicle theft remain the biggest headaches; if you park a Subaru downtown overnight, a steering-wheel lock isn’t a bad idea.
Violent Crime
Violent crime makes smaller headlines but can feel outsized in community chatter. The same dataset records 1,655 violent crimes in 2023, a violent crime rate of roughly 596 per 100k — about 55% higher than national rates.
Assault leads the pack, followed by robbery; homicides remain comparatively rare for a city this size.
Other Crime Data
Beyond property and violent crimes, nuisance categories like vandalism and drug-related offenses appear across the Reno crime map but rarely skew total crime metrics.
DUI arrests spike during summer events, and outdoor recreation hotspots around Reno see seasonal upticks in vehicle break-ins.
Comparison of Reno Crime Rates with Nevada
Stack Reno against statewide numbers and the picture sharpens: Nevada’s 2023 violent crime rate was about 417 per 100,000, and its property crime rate hovered near 2,517.
So the crime rate in Reno runs hotter than the state of Nevada as a whole, especially on the violent side, while property figures sit just a hair above NV crime rates.
Trends in Reno Crime Rates
Year-over-year comparisons hint at a slow cooling: total crime fell 5 % from 2022 to 2023, with property offenses dropping nearly 7%. Violent incidents, however, ticked up 3%, reminding Reno residents that overall crime rate gains can mask stubborn trouble spots.
Comparing Crime Rates: Reno vs. Nearby Cities
Crime Rate Comparison with Neighboring Cities
Reno’s immediate neighbors paint a mixed picture. Sparks, just across the Truckee River, posts about 417 violent crimes and 2,011 property crimes per 100,000 residents—meaning its violent crime rate is roughly 25 % lower than Reno’s, but its property crime rate isn’t far behind.
Head 30 miles south to the capital and you’ll find Carson City averaging roughly 400 violent crimes and 1,143 property crimes per 100k. That keeps total crime around 4,929 incidents per 100,000, noticeably lower than Reno on both counts and closer to the statewide average.
Cross the state line to mountain-town Truckee, CA, and the contrast sharpens: its violent crime rate climbs to about 639 per 100k, yet property crime dives to roughly 509 per 100k—one-fifth of Reno’s.
Stacked side-by-side, the takeaway is simple: Reno’s violent crime sits higher than most of its neighbors, and its property crime leads the pack by a wide margin.
Sparks edges closest, Carson City offers a middle-ground safer vibe, and Truckee trades a bump in assaults for far fewer break-ins—useful context if you’re weighing which corner of the Sierra front feels best to call home.
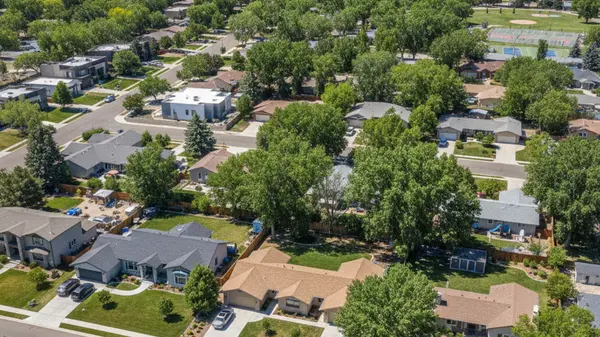
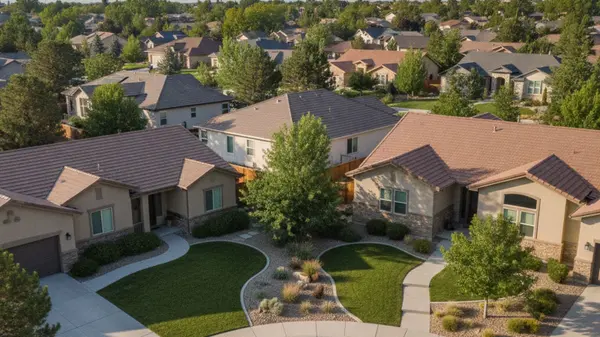
Identifying the Safest Areas in Reno
Best Places to Live in Reno
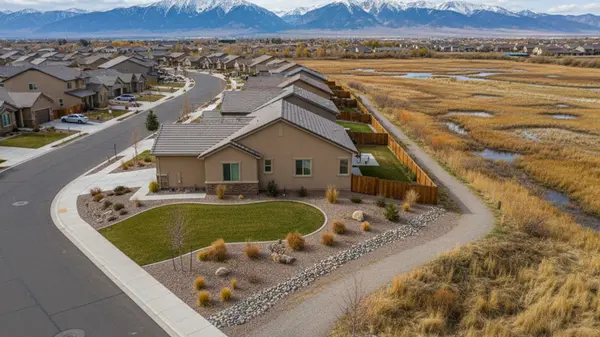
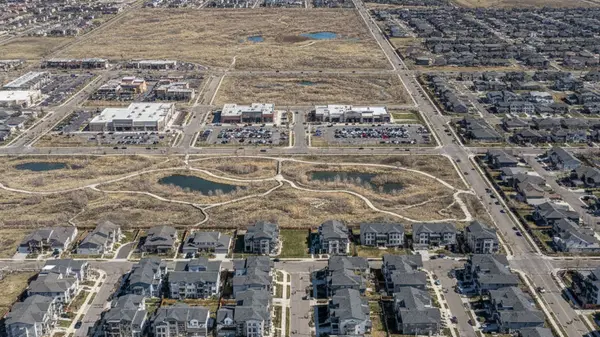
Ask any moving to Reno guide and you’ll hear the same neighborhoods in Reno praised: Northwest Reno’s cul-de-sacs, the newer developments in South Reno, and foothill enclaves like Mogul or ArrowCreek consistently land on “best places” lists.
Niche.com ranks Incline Village (technically across the county line but part of the Reno area) as a top place to live, while AreaVibes tags Northwest and South Reno as safest.
Buyers hunting homes for sale in Reno, NV, inside these ZIP codes often pay a premium for those lower crime rates and statistics.
Safety Measures and Resources
Chance of Being a Victim of Crime in Reno
Crunch the numbers, and the chance of becoming a victim of any reported crime sits around 1 in 31; break that down, and you face a 1 in 164 chance of being the victim of violent crime and a 1 in 36 chance of becoming a victim of a property crime.
While the figures are higher than the national average, they’re far from a guarantee that you’ll become a victim of crime in Reno.
Role of the Reno Police Department
The Reno Police Department fields more than 70,000 calls for service each year and leans heavily on community-oriented policing.
From extra patrols around special events to bike units along the river corridor, RPD’s presence is most visible downtown, but recent budget additions put more officers in suburban beats too.
Community Safety Initiatives
Grassroots efforts matter.
Neighborhood watch groups in the city of Reno partner with police to circulate real-time crime data, while nonprofits like Truckee Meadows Tomorrow compile detailed crime rates for public dashboards.
Volunteers host “Vin Etch” days to deter vehicle theft, and South Reno HOAs fund extra security patrols — proof that Reno offers residents a say in shaping safer streets.
Living in Reno: Is It a Safe Place to Live?
Take the numbers, the trends, and the on-the-ground feel, and you’ll find a city of contrasts. Reno crime is higher than the national average, but it’s concentrated in specific corridors and often tied to property theft rather than assaults.
Many Reno residents describe day-to-day life as relaxed — they lock bikes, keep porch lights on, and still stroll the Riverwalk at dusk.
For those weighing schools, cost of living, and the chance of being the victim of a property crime versus a violent one, Reno can be a safe place to live if you choose neighborhoods wisely and follow ordinary urban precautions.
Conclusion and Recommendations
Summary of Crime Statistics
Reno’s overall crime rate hovers around 3,235 incidents per 100,000 residents—about 35 % higher than the national average. Within that total, the violent crime rate sits near 596 per 100k (≈ 55 % above national norms) while the property crime rate holds at roughly 2,639 per 100 k (≈ 31 % higher).
Drill down and you’ll find vehicle theft inflates the property numbers most, followed by classic smash-and-grab burglary. Meanwhile, aggravated assaults drive the majority of violent-crime reports; homicides remain comparatively rare for a city of Reno’s size.
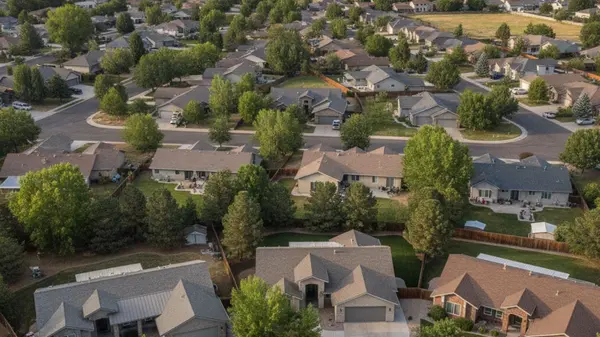
Neighborhood patterns matter: South Reno, Northwest Reno, and foothill pockets like ArrowCreek routinely post a lower crime rate than Reno’s citywide average, whereas the downtown corridor and older mid-town grids shoulder the heaviest load of reported crime.
Trend-wise, total crime fell about 5 % from 2022 to 2023, thanks largely to a 7 % dip in property offenses, even as violent incidents ticked up 3 %. The takeaway? Reno crime is higher than the national average, but it’s inching in the right direction and remains highly pocket-specific.
Future Outlook for Crime in Reno
With a diversifying economy, a tight Reno housing market that discourages vacancy blight, and continued staffing gains at the Reno Police Department, most analysts expect gradual improvements in both violent and property crime over the next few years.
Still, hot spots along the Virginia Street spine and vehicle-theft clusters near I-80 interchanges will demand attention.
Keep an eye on updated Reno crime maps, engage with neighborhood watch programs, and you’ll likely find that Reno offers a solid balance of mountain-town lifestyle and big-city amenities—a safe place to live for most residents who pair common-sense precautions with smart neighborhood choices.
Ask C
The Bottomline
From the neon of downtown to the quiet cul-de-sacs of South Reno, the city is home to several lifestyles.
Compare Reno to cities in the state or nationwide and you’ll see a mix of higher crime pockets and safe streets — proof that Reno a safe place or Reno safe is ultimately about where you land, how you engage, and whether you view the Little City in the World as an adventure worth embracing.
Reno Safety FAQs
Is Reno safe at night?
Downtown and mid-town corridors see more reported crime, but South Reno and many suburban tracts post lower crime rate than Reno’s core. Exercise normal city smarts after dark.
Which neighborhoods have the lowest crime rates?
Northwest Reno, Double Diamond, and pockets of Caughlin Ranch consistently rank among the safest and most dangerous lists’ “safest” side, boasting detailed crime rates well below city averages.
How do property and violent crimes compare year over year?
Property offenses dropped nearly 7% last year, while violent incidents crept up 3%. The overall crime rate trend is modestly downward, but violent crime bears watching.
Does the weather influence crime in Reno?
Seasonal swings matter: summer tourism brings higher foot traffic (and sometimes higher theft), while winter storms keep many indoors, nudging crime per capita briefly lower.
How can new arrivals stay informed?
Check the Reno crime map for block-level updates, follow Reno Police Department social feeds, and join neighborhood groups to compare Reno stats in real time.
Categories
Recent Posts