Is Carson City, NV a Safe Place to Live? A Look at Crime Rates and Statistics
Overview of Carson City
Introduction to Living in Carson City, NV
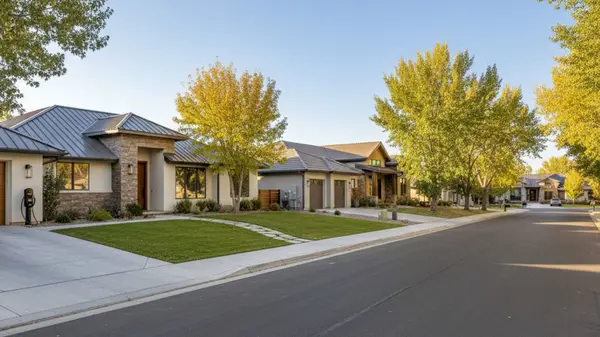
Carson City sits in an odd Goldilocks zone. It is large enough to host Nevada’s legislature, yet compact enough that people still wave when you let them merge.
Ask long-time residents why they live in Carson City, and they talk about slipping up to Lake Tahoe after work, hopping thirty miles north to Reno for a Wolf Pack game, and coming home to streets that fall quiet by ten. All that convenience sparks one big question for anyone shopping for homes for sale in Carson City, NV: how safe is the capital of Nevada?
This deep dive leans on FBI crime tables, state dashboards, and local sheriff briefings so you can decide whether to move to Carson City or keep scrolling listings elsewhere.
Geographical Location
Geography does plenty of heavy lifting for safety.
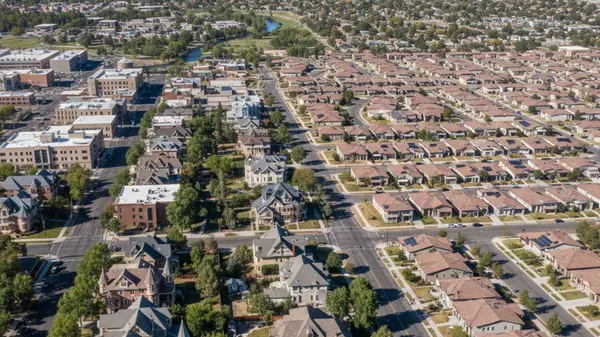
Carson City spreads across roughly 157 square miles on the eastern slope of the Sierra Nevada, meaning population density is below 500 residents per square mile even after the last census bump. U.S. Highway 395 bisects town north–south, while the new I-580 bypass whisks commuters toward Reno without grinding local intersections.
Those broad corridors concentrate rush-hour traffic in predictable pockets, letting deputies stage speed traps and DUI checkpoints instead of chasing random side-street mayhem.
Because the city sits 4,700 feet above sea level and twenty minutes from the Tahoe basin, winter powder draws skiers who tend to crash slopes rather than bars, an odd but welcome quirk when you compare Carson City nightlife to other state capitals.
Overview of Crime in Carson City
The newest NeighborhoodScout scrape of FBI files shows an overall crime rate of 11.89 incidents per 1,000 residents. Break that down, and violent crime lands at 2.81 while property crime rests at 9.08.
Translating those ratios into human odds means a one-in-356 chance of becoming a victim of a violent crime and a one-in-110 chance of falling prey to property crime.
The total crime footprint equals 690 police reports for a population just under 59,000, small compared to numbers logged in Nevada’s other metro hubs.
Factors Influencing Crime Rates
Several forces push those numbers lower than you might expect for a seat of government.
First, steady agency paychecks buffer households from the boom-bust swings that plague mining or casino towns; stable income correlates with lower theft.
Second, the Carson City Sheriff’s Office pursues a data-driven patrol model known as DDACTS, short for Data-Driven Approaches to Crime and Traffic Safety, which overlays crash and crime maps so the same cruiser deters both accidents and burglaries.
Third, housing remains attainable: the May 2025 median sales price for an existing single-family home clocked in at $585,000, a figure high but still lighter than coastal California. That pricing balance discourages the kind of rapid displacement that often seeds petty crime in boom markets.
Carson City Crime Reports and Data
Property Crime
Property crime in Carson City totaled 527 incidents last year, translating to a property crime rate of 9.08 per 1,000 residents.
Larceny—often a polite word for rummaging through unlocked cars—accounts for nearly forty percent of those cases. Burglary comes next, followed by motor-vehicle theft and the occasional arson, though the fire marshal notes that most “arson” labels involve trash-bin flare-ups rather than dramatic structure fires.
Compared with the Nevada state property crime average of 25.17 per 1,000 and the national average of roughly nineteen, Carson City posts enviably low ratios.
Violent Crime
Violent crime statistics tell a similarly reassuring story.
The city recorded just 163 violent offenses last year: one homicide, thirty-six rapes, eight robberies, and 118 aggravated assaults. Converted to a violent crime rate, Carson City stands at 2.81 per 1,000 residents—well beneath the Nevada mean of 4.17 and below the national median of four.
Sheriff Ken Furlong’s January briefing noted a further ten-percent decline in violent offenses through the first half of 2025, mirroring FBI quarterly trends that show murder, rape, robbery, and aggravated assault dropping across most of the Mountain West.
Other Crime
Not every offense neatly fits property or violence labels. The sheriff’s blotter lists 753 crimes against society in 2024, ninety percent of which involve narcotics possession or paraphernalia.
Interestingly, overdose calls fell by almost half during the same period, suggesting that Naloxone distribution, mental-health diversion via the Mobile Outreach Safety Team, and a flurry of fentanyl-awareness classes in Carson City School District high schools are paying dividends.
Because those incidents are classified separately from property or violence, they do not spike the headline crime rate, but they factor heavily into resource allocation for patrol, EMS, and social services.
Trends in Carson City Crime Rates
Zoom out to a three-year window, and the trajectory looks even stronger.
In 2022, the overall rate sat near forty-nine incidents per 1,000 residents when calculated under the broader NIBRS coding system.
By 2023, that figure slid to 49.02, and preliminary 2024 tallies—again using NIBRS definitions, which count more offense types than the old summary system—show a rate of 44.76. Sheriff analysts attribute the downward curve to predictive patrols, expanded bike units downtown, and license-plate recognition cameras at three key freeway ramps.
Those gains survived two tough stress tests: a post-pandemic tourism rebound and a legislative session that doubled weekday foot traffic around the Capitol.
Comparing Crime Rates: Carson City vs. Nearby Cities
Compare Carson City Crime Rates with Nearby Cities
When newcomers skim NV crime rates, they inevitably compare Carson City with its better-known neighbor to the north.
Reno posts a total crime rate of 33.96 per 1,000 residents, nearly triple the Carson figure, with violent crime at 6.11 and property crime at 27.85.
Sparks, eight miles east of Reno, logs roughly thirty crimes per 1,000 and violent odds of one in 255.
Even Incline Village—a postcard resort hamlet on the north shore of Tahoe—charts a combined rate of twelve per 1,000, nearly matching Carson but at far higher housing costs.
Those contrasts underline why buyers who prize low crime often slide down Highway 395 and plant a flag in the state capital instead of Reno-Sparks.
Crime Rate Comparison with the State of Nevada
Stack Carson City’s 11.89 incidents per 1,000 against the Nevada state average of 29.34, and the capital looks like a statistical bargain.
Violent crime statewide registers at 4.17 per 1,000, and property crime lands at 25.17, both well north of Carson’s tallies.
Put another way, living in Carson cuts your chance of being a victim of a violent crime from one in 240 statewide to one in 356 locally, and your property-crime odds from one in 40 to one in 110.
Crime Rate Comparison with the National Average
The national median for violent crime sits at four per 1,000 residents, and property crime at about nineteen.
Carson’s 2.81 and 9.08 figures undercut those markers by wide margins.
In fact, NeighborhoodScout awards the city a safety index of 38, meaning Carson City is safer than thirty-eight percent of U.S. communities despite being a state capital that draws tourists, lobbyists, and bureau staff.
Identifying the Safest Areas in Carson City
Best Places to Live in Carson City
Safety in Carson City is not evenly distributed, but even its toughest blocks rarely mimic big-city hotspots.
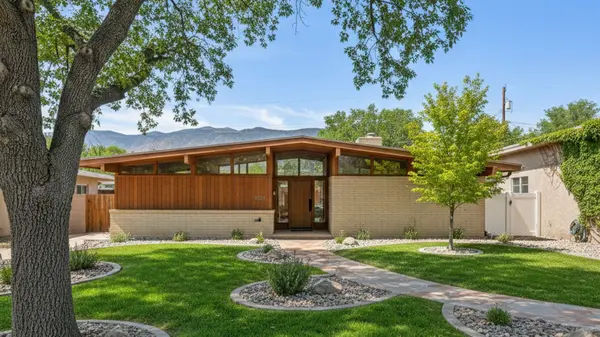
NeighborhoodScout ranks Kings Canyon, Lakeview, Indian Hills, Northridge, Arrow Head, and Goni Canyon Estates at the top of its local index. These enclaves share three traits: limited through-traffic, newer construction that favors attached garages and motion lighting, and community associations that feed real-time tips to patrol deputies.
Because many of these subdivisions in Carson City perch on the western bench above downtown, they enjoy natural surveillance as well; porch lights overlook the valley floor, and would-be prowlers stick out against open sagebrush slopes.
Safety Measures and Resources
Chance of Being a Victim of Crime in Carson City
Transforming ratios into plain odds helps house-hunters grasp risk. The overall chance of experiencing any reportable offense is one in 84, well below many suburbs encircling Sacramento, Salt Lake City, or Phoenix.
Violent risk drops to one in 356, meaning a resident could attend a concert every weekend for six years and statistically avoid an assault.
Property risk at one in 110 mainly concerns unlocked tailgates in grocery parking lots and porch-pirate runs during the holiday shipping season.
Role of the Carson City Police Department
The Carson City Sheriff’s Office is unusual because it combines city police and county deputies under one badge, streamlining command and data integration.
Patrol districts update heat maps every Wednesday; cruisers migrate accordingly, so a stretch of Alpine Street that suffered three catalytic-converter thefts last month may see a cruiser idling with headlights off at three a.m. next week.
School-resource officers embed in every Carson City School District campus; their vaping citation counts feed the same dashboard that tracks robbery and auto theft, allowing criminologists to spot behavioral spillovers early.
Body-camera footage uploads by sunrise and receives a supervisor review before the next shift briefing, a practice that boosts transparency and, arguably, deters excessive-force complaints.
Community Safety Initiatives
Neighborhood engagement in Carson City feels old-school compared with metropolitan apps, yet it works.
The sheriff’s quarterly town-hall road show attracts retirees who scribble license-plate numbers on loose-leaf and parents who want an extra crosswalk guard.
CrimeMapping.com pushes those field reports to a public Carson City crime map that refreshes every 24 hours. Citizens can draw custom alert zones around their subdivision, receiving an email when deputies flag a stolen bike or investigate an arson attempt.
The Mobile Outreach Safety Team, a partnership of deputies and mental-health clinicians, answers calls that would otherwise escalate into violence; their overdose-reversal tally climbed past two hundred lives saved since 2021. That is not a conventional crime-rate metric, but every fatality averted removes the trigger for retaliatory violence or burglary to fund addiction.
Living in Carson City: Is it a Safe Place to Live?
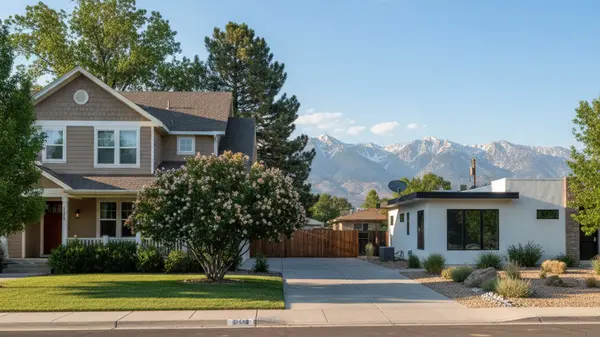
Safety indices, trend lines, and deputy deployment models point to one conclusion: Carson City is one of the safest midsize communities in Northern Nevada.
When you factor cost of living—BestPlaces pegs the city at 109.4 compared with a U.S. baseline of 100—and a median sold price near $570,000 noted by Redfin, the value equation strengthens.
Add in modest population growth, quality health care anchored by Carson Tahoe Regional Medical Center, and quick drives to Tahoe powder, and the decision to relocate leans common sense.
Conclusion and Recommendations
Summary of Crime Statistics
Carson City records 11.89 total crimes per 1,000 residents, splitting neatly into 2.81 violent and 9.08 property.
Those numbers undercut the Nevada state average by more than half and beat national medians by wide margins. T
hree years of downward motion—roughly twenty-three percent fewer total incidents since 2022—affirm that the dip is durable, not a blip.
Housing prices climb but remain manageable relative to major job hubs, preserving the socio-economic stability that often shields communities from crime spikes.
Future Outlook for Crime in Carson City
Looking ahead, the sheriff’s 2025 budget funds another MOST mental-health team, expands automatic license-plate reader coverage from three intersections to nine, and upgrades deputy body-worn cameras to livestream during pursuits. Those investments, plus state grants for child-care vouchers that cushion economic stress, should keep crime graphs tilting downward.
If projections hold, Carson City may dip near ten crimes per 1,000 by 2026, vaulting it into the top third of safest state capitals on a per-capita basis.
Given that trend, buyers weighing relocation need not hesitate on safety grounds; the capital’s track record and trajectory both signal low crime rates for years to come.
Moving to Carson City? Here's the Bottom Line
From the perspective of statistics, policing innovations, and daily lived experience, Carson City stands out as a safe place to live, work, and experience community.
Whether you want to explore crime data down to the intersection, stroll downtown Carson under historic lamp posts, or lock in a mortgage before the next Lake Tahoe snowstorm, the numbers suggest you can do so with confidence and the comfort that comes from genuinely low crime rates.
Carson City Safety FAQs
Is Carson City safer than Reno?
Reno posts 33.96 crimes per 1,000 residents while Carson City registers 11.89, making the capital nearly three times safer on paper and notably calmer on the street.
What type of crime is most common in Carson City?
Simple larceny, chiefly theft from unlocked vehicles or front porches, represents about four in every ten police reports, overshadowing violent categories by a wide margin.
Where can I check real-time crime activity?
The Carson City crime map on CrimeMapping.com syncs with dispatch logs every night, allowing residents to explore crime patterns block by block without waiting for monthly summaries.
How do housing costs relate to safety?
A BestPlaces cost-of-living score of 109.4 and a median sale price around $535,000 keep the market accessible, reducing economic churn that often fuels higher crime; low foreclosure rates stabilize neighborhoods and discourage squatters.
Are local schools considered safe?
The Carson City School District logs minimal on-campus incidents, and each campus hosts a school-resource deputy. Youth Services officers note that vaping and minor scuffles dominate reports, leaving serious assaults rare in classrooms. carsonnow.org
Categories
Recent Posts